How We Test GPS Watches: Our Review Methodology
Most GPS watch reviews start with the same information you can already find on the product page. Battery life. Display size. GPS modes. Training features. Mapping. Sensors.
That information matters, but it does not tell you whether the watch is actually accurate. That is where our testing starts.
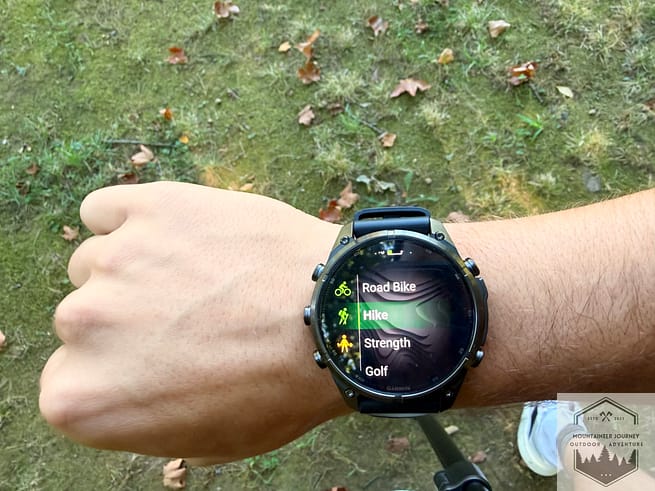
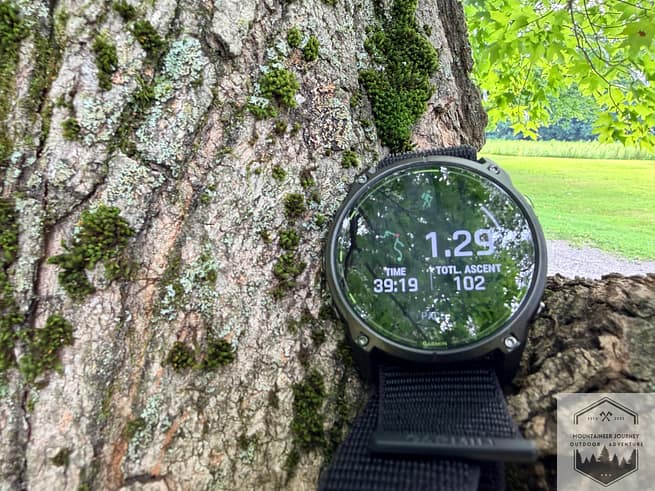
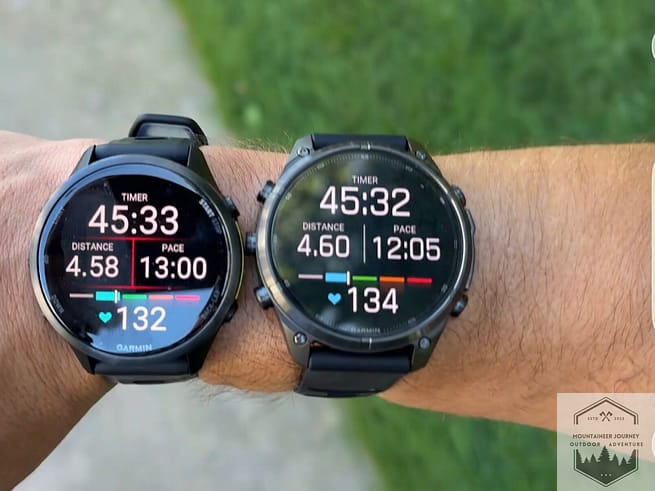
At Mountaineer Journey, we physically test every GPS watch we review and score it using the same objective testing system. We run with them, hike with them, navigate with them, track workouts with them, and compare their data against reference equipment rather than simply trusting what the watch reports.
Accuracy carries the most weight in our scoring system for a reason.
A watch can have beautiful maps, dozens of training metrics, and a bright AMOLED display, but none of that matters if the GPS track drifts off the trail or the heart rate sensor gives you bad data.
That’s where our testing goes much deeper than simply putting two activity files side by side and saying they look close.
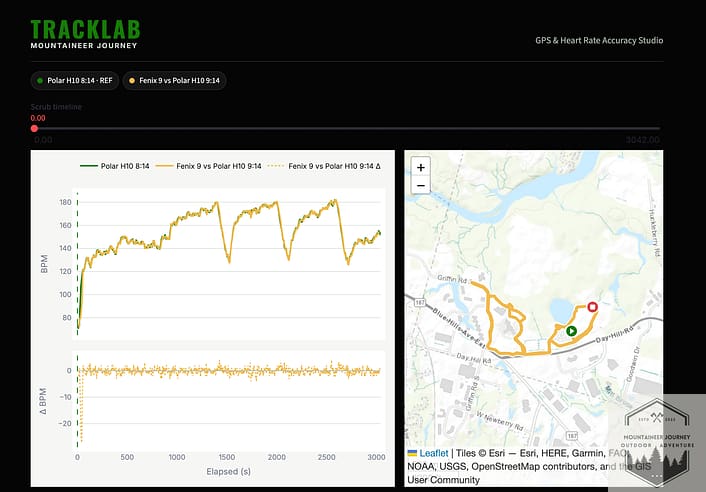
We developed our own GPS watch testing software, Track Lab, specifically for these reviews.
Track Lab lets us take data recorded by a GPS watch and compare it directly against our reference data. For heart rate testing, that means comparing the watch against a Polar H10 chest strap. For GPS testing, it means analyzing the actual recorded track instead of judging accuracy based only on the final mileage.
The software can identify average heart rate error, large sensor failures, heart rate latency, cadence lock, GPS drift, cross-track error, distance error, and several other measurements that are almost impossible to judge accurately just by looking at a graph.
That matters because a watch can look extremely accurate at first glance and still have problems buried inside the data.
A GPS watch might report almost the exact correct distance while cutting corners throughout the route. A wrist-based heart rate sensor might follow a chest strap almost perfectly for most of a run, but fall 20 or 30 beats behind during a rapid change in effort.
Those are the problems we are trying to find.
Our goal is not to prove that a GPS watch works.
It is to find out where it stops working well, how large the error is, and whether that error actually matters when you are using the watch.
That data, combined with our real-world testing, is what ultimately determines the scores you see throughout our GPS watch reviews and comparisons.
To see some of our top GPS watch reviews, check out: Garmin Forerunner 970 review, Garmin 170, Coros Pace 4, Garmin Enduro 3, Garmin Fenix 9, Apple Watch Ultra 3, and Garmin Venu 4.
We Actually Test Every GPS Watch We Review

We use every GPS watch we review the way it was designed to be used.
That means running with it, hiking with it, navigating with it, tracking workouts, watching battery drain, and comparing the data it records against our reference equipment.I do not think you can properly judge a GPS watch by wearing it for a few easy runs and checking whether the final mileage looks close.
Different conditions expose different weaknesses.
A watch can look extremely accurate on an open road and then start drifting once you move under heavy tree cover. It can hold heart rate almost perfectly during a steady run, then fall behind when your effort changes quickly. Mapping can look great on a product page, but feel completely different when you are actually trying to follow a route on trail.
That is why we try to put each watch into situations that make the sensors work.
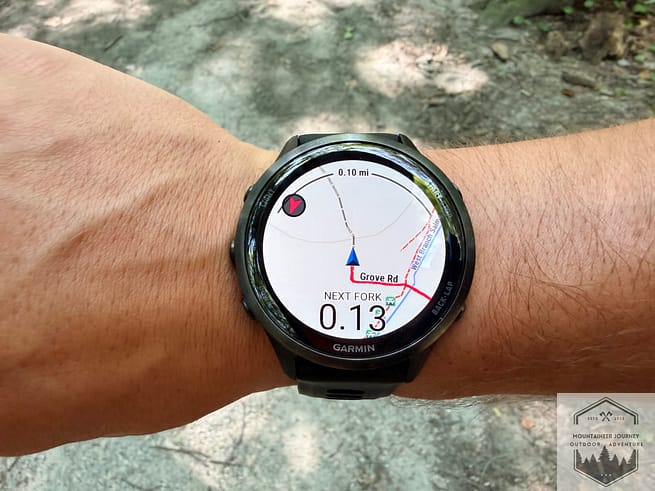
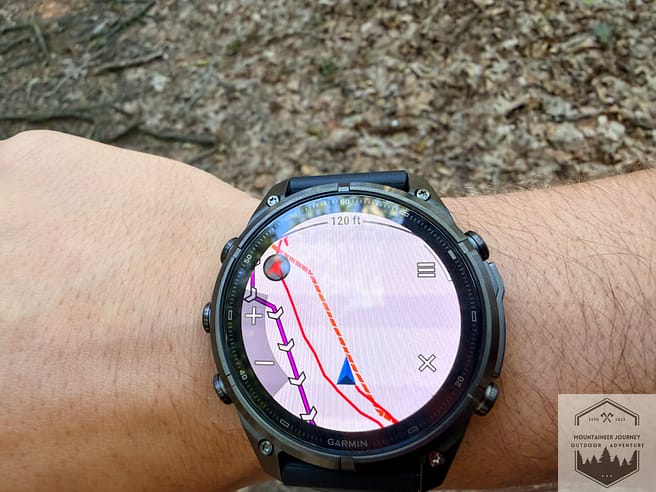
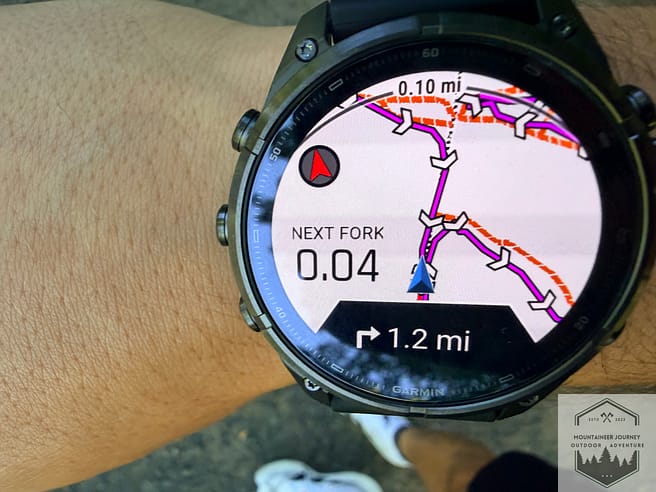
We look at longer activities, elevation changes, turns, technical trails, faster efforts, slower efforts, and changes in intensity. When we test navigation, we follow routes and use the watch in the field rather than simply checking whether a mapping feature exists in the menu.
The same applies to battery testing.
We care about what the watch actually delivers during normal use, GPS activities, navigation, and longer days outside, not just the number printed on the specification sheet.
This gives us a much better picture of what the watch is actually good at and, just as importantly, where it starts to struggle.
For us, testing isn’t about confirming the manufacturer’s claims.
It is about finding out whether those claims still hold up once the watch is on your wrist and doing the job you bought it for.
Every GPS Watch Is Scored Using the Same System
After testing, every GPS watch goes through the same scoring system.
We do this to keep reviews consistent.
A Garmin isn’t scored one way while a COROS, Apple Watch, or Suunto is scored another.
We judge every watch across the same core categories, with the same weighting.
| Testing Category | Weight |
|---|---|
| Accuracy | 30% |
| Battery Life | 20% |
| Mapping and Navigation | 20% |
| Features and Training | 10% |
| Versatility | 10% |
| Value | 10% |
Accuracy carries the most weight at 30 percent. That is intentional.
A watch can have excellent training features and a great display, but if the GPS track is drifting or the heart rate sensor is consistently wrong, that affects almost everything else the watch is trying to tell you.
Battery life and mapping also carry more weight because they matter heavily for hikers, trail runners, and anyone spending long days outside.
Features, versatility, and value still matter, but they shouldn’t hide poor core performance. This also means we do not hand out high scores just because a watch has more features. For example, the Garmin Fenix 9 probably has the most features out of any watch available, yet the Garmin Forerunner 970 has fewer and scored the same for features.
A cheaper watch with better accuracy and dependable navigation can score extremely well.
A much more expensive watch can lose points if the testing does not support the price.
The final score comes from those weighted categories rather than a general feeling after wearing the watch.
That gives us a repeatable way to compare completely different models and, more importantly, it forces every watch to earn its score through the same testing process.
Meet Track Lab: Our GPS Watch Testing Software

This is where our GPS watch testing goes a lot deeper.
We developed Track Lab specifically for our GPS watch reviews because we wanted a better way to measure what was actually happening inside the data.
Looking at two GPS tracks on a map can be useful. Looking at two heart rate lines can be useful.
But neither one tells the whole story.
Two lines can look nearly identical while still hiding meaningful errors.
A watch can follow a Polar H10 chest strap extremely closely for most of a run, then suddenly fall 20 or 30 beats behind during a harder effort. A GPS track can look clean on a map while still cutting corners, drifting off the trail, or recording the wrong distance.
Track Lab was built to find those problems.
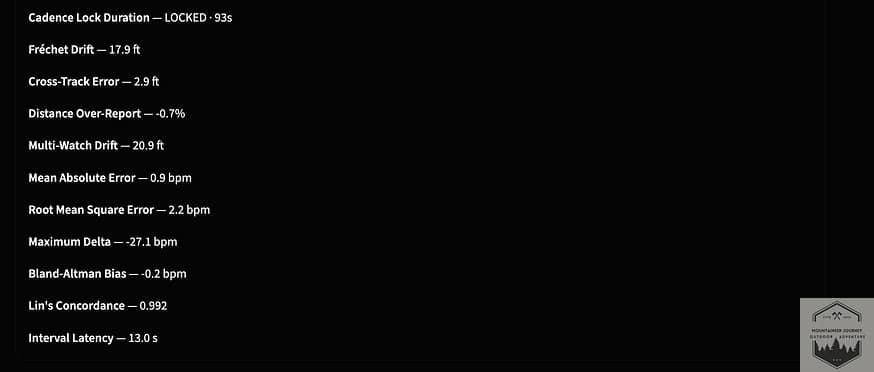
Instead of relying on a visual comparison, the software measures the actual size of the error, how often it happens, how long it lasts, and what type of error we are seeing.
For heart rate testing, Track Lab can measure things like average error, large deviations, systematic bias, response latency, and cadence lock.
For GPS testing, it can measure cross-track error, route drift, distance error, and how closely the recorded path follows our reference track. This gives us something much more useful than saying a watch looked accurate. It gives us numbers we can compare from one watch to the next.
And that matters because not all errors are equal.
A watch that is consistently one beat per minute off is behaving very differently from a watch that is almost perfect for 95 percent of the workout, then suddenly misses by 25 beats per minute.
The average can make both watches look good. Track Lab helps us see the difference.
The same thing happens with GPS.
A watch can finish a five-mile route with almost perfect total distance and still make mistakes throughout the activity.
It might cut a switchback here, drift through the trees there, then accidentally make up that lost distance somewhere else. The final mileage looks great. The actual GPS performance was not.
That is exactly why we built Track Lab.
We wanted our accuracy scores to be based on more than a quick glance at a graph.
We wanted to know how accurate the watch was, where it failed, how badly it failed, and whether that failure actually matters when you are using it.
That data becomes one of the biggest pieces of evidence behind the accuracy scores you see in our GPS watch reviews.
How We Test Heart Rate Accuracy
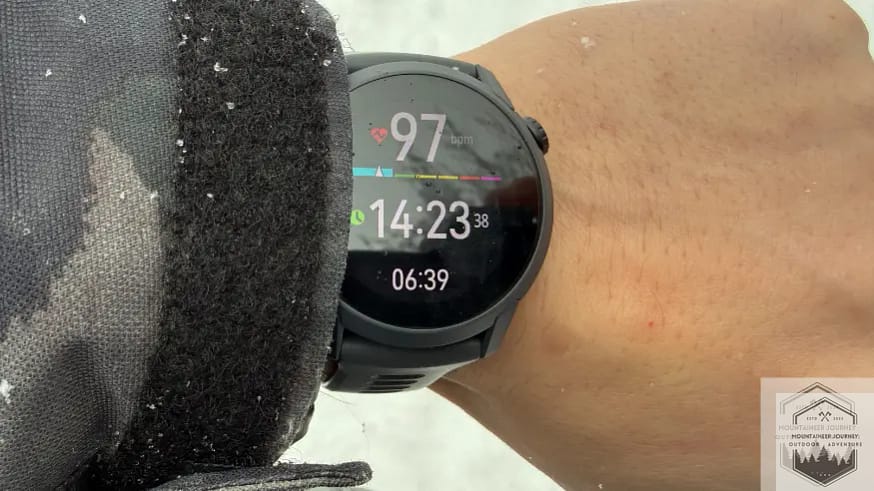
Heart rate accuracy is one of the easiest areas to oversimplify in a GPS watch review.
You can put a watch next to a chest strap, look at the two lines, and say they look close.
We wanted something more objective.
For our heart rate testing, we use the Polar H10 chest strap as our reference and compare its recorded data directly against the optical heart rate sensor inside the watch.
We then analyze that comparison in Track Lab.
This lets us see more than whether the two graphs appear to follow each other.
We can measure the average error throughout the activity, the largest individual miss, whether the watch consistently reads too high or too low, how quickly it responds when heart rate changes, and whether the optical sensor ever locks onto running cadence instead of actual heart rate.
That last part is important because a watch can look extremely accurate during steady running and still struggle the second your effort changes.
You might start climbing a hill, and your actual heart rate rises quickly.
The chest strap sees that change almost immediately.
A wrist-based optical sensor may take several seconds to catch up.
Eventually the two lines meet again, and if you only look at the entire workout afterward, the watch can still appear extremely accurate.
But during that harder effort, it was behind.
Track Lab allows us to measure that delay instead of guessing.
The same applies to larger sensor failures.
In the example below, the Fenix 9 stayed extremely close to the Polar H10 for most of the test, but Track Lab still identified a much larger individual deviation buried inside the activity.
That is exactly why we use several different heart rate metrics instead of relying on one average accuracy number.

Each of those measurements tells us something different about how well the heart rate sensor actually performed.
Mean Absolute Error: MAE
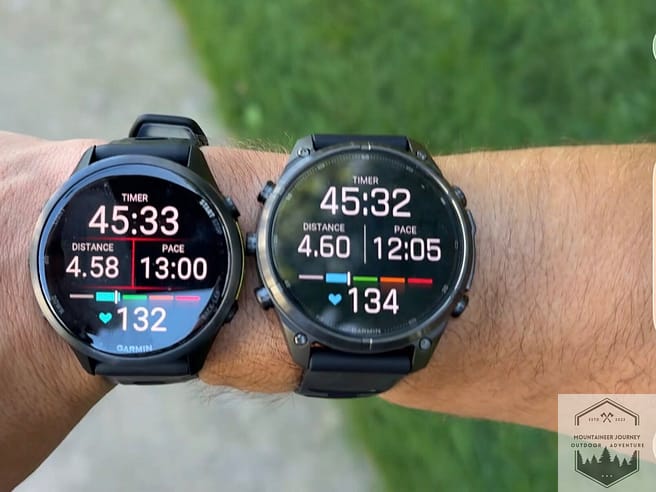
The first heart rate metric we look at is Mean Absolute Error, or MAE.
This is one of the simplest ways to understand how close the watch stayed to the Polar H10 throughout the entire activity.
MAE measures the average difference between the heart rate recorded by the watch and the heart rate recorded by our chest strap reference.
If the Polar H10 records 160 BPM and the watch records 162 BPM, that is a two beat error.
Track Lab calculates those differences across the entire workout and gives us one average number.
Lower is better.
In the Fenix 9 example above, the MAE was just 0.9 BPM.
That means the watch stayed extremely close to the Polar H10 on average throughout the test.
That’s also why we never use MAE by itself.
A watch can have an excellent average error while still having a few major failures buried inside the workout.
If the sensor is nearly perfect for most of the activity but suddenly misses by 20 or 30 BPM, the average can still look very good.
So MAE gives us a strong picture of overall heart rate accuracy, but it does not tell us everything about consistency.
Root Mean Square Error: RMSE
Next, we look at Root Mean Square Error, or RMSE.
This is where we start to catch the bigger misses that average error can hide.
RMSE still looks at the difference between the watch and the Polar H10, but it weights larger errors more heavily.
That matters because a watch that is one or two beats off for most of a run is very different from a watch that is nearly perfect most of the time, then suddenly misses by 20 BPM during a harder effort.
MAE can make both watches look better than they really are.
RMSE makes those larger failures harder to hide.
In our Fenix 9 example, the RMSE was 2.2 BPM.
That was still very strong, especially because the watch stayed close to the Polar H10 for most of the test.
But RMSE gives us a better idea of how stable that accuracy was throughout the activity.
This is important if you use heart rate for intervals, hill efforts, training zones, or recovery because a short but significant error can still affect the data you see during that workout.
So while MAE tells us how accurate the watch was on average, RMSE helps show us how much the larger mistakes affected the overall result.
And if RMSE starts climbing while MAE stays low, that usually means the watch had a few bigger failures buried in an otherwise accurate test.
Maximum Delta
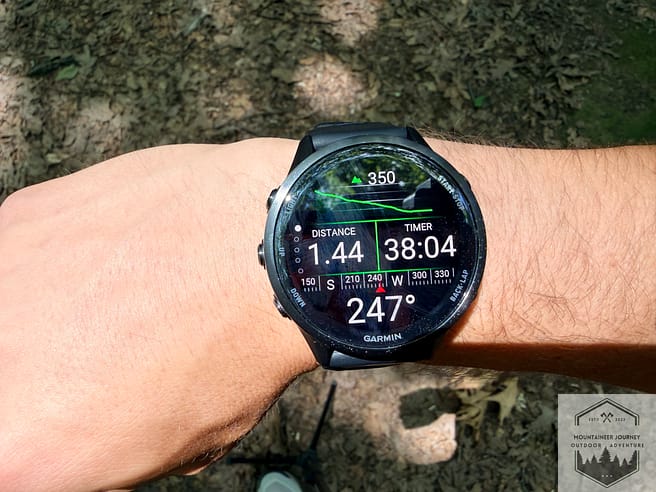
Next, we look at is Maximum Delta.
This shows us the single largest heart rate difference between the GPS watch and the Polar H10 during the test.
In our Fenix 9 example, the maximum delta was 27.1 BPM.
That is important because it shows something the average numbers cannot.
A watch can post an excellent MAE and a strong RMSE, but still have one moment where the optical sensor completely loses the actual heart rate.
That is exactly what Maximum Delta is designed to expose.
If the Polar H10 is reading 165 BPM and the watch suddenly drops to 138 BPM, that is not a small miss.
It can change what the watch thinks your effort level is, especially during intervals, steep climbs, or any workout where heart rate is changing quickly.
The direction of the error also matters.
If the number is negative, the watch was reading below the Polar H10 at its largest miss. If it is positive, the watch was reading above it.
We do not use this metric by itself either.
One large miss over a long activity does not automatically make a watch inaccurate.
But it does tell us how bad the worst sensor failure was.
That gives us a better picture of how dependable the heart rate sensor is when it does make a mistake, not just how accurate it is on average.
Bland Altman Bias
The next metric we use is Bland Altman Bias.
This tells us whether the watch has a tendency to read consistently higher or lower than the Polar H10.That matters because two heart rate sensors can follow the same pattern very closely and still disagree with each other.
A watch might rise and fall at almost the exact same time as the chest strap, but sit three or four beats higher for most of the workout.
At a quick glance, the graphs can look almost perfect.
The data tells a different story. In our Forerunner 970 example, the Bland Altman Bias was just 0.2 BPM below the Polar H10.
That is extremely close to zero, which tells us there was very little consistent overreading or underreading throughout the test.
This metric is especially useful because it helps us separate random mistakes from a consistent sensor bias.
If a watch is always reading a little high, that can start to affect training zones and long term heart rate data even if the graph itself looks smooth.
So Bland-Altman bias helps answer a simple question.
Is the watch consistently leaning in one direction, or is it actually agreeing with the reference?
Lin’s Concordance Correlation Coefficient
The next metric we use is Lin’s Concordance Correlation Coefficient.
In simple terms, it tells us how closely the watch agrees with the Polar H10 across the entire test.
A value closer to 1.0 means stronger agreement. In our Fenix 9 example, the score was 0.992, which is very strong.
This metric matters because two heart rate lines can move in the same direction and still be several beats apart.
Lin’s Concordance helps show whether the watch is actually matching the reference, not just following the same general pattern.
It gives us one more way to confirm whether the heart rate data is truly accurate.
Interval Latency

The next metric we look at is Interval Latency. This measures how quickly the watch responds when heart rate changes compared with the Polar H10.
For example, the Forerunner 970 averaged 16 seconds of latency. This isn’t a huge deal if we’re doing 8-minute interval sessions; however, it matters if we’re doing 30-second hill intervals. By the time the watch catches up to the chest strap, we are done with that specific interval.
That matters because a watch can eventually reach the correct heart rate and still be too slow getting there.
For steady running, that delay may not matter much. For interval training, it can.
This is why we measure latency separately instead of assuming a good average heart rate score tells the whole story.
Cadence Lock Duration
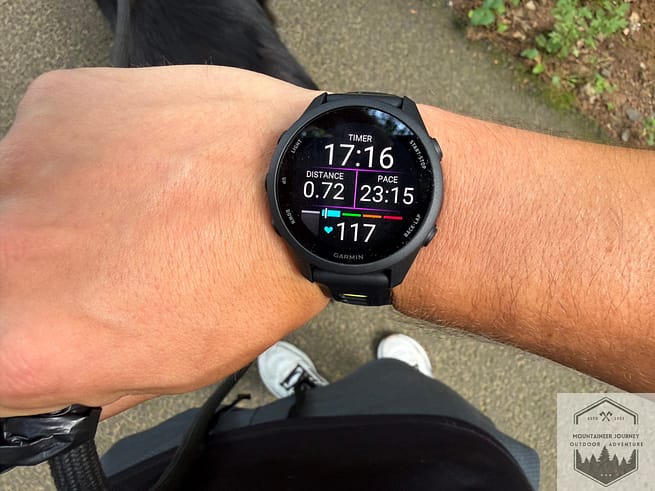
The next metric we look at is Cadence Lock Duration. Cadence lock happens when the optical heart rate sensor starts reading your running cadence instead of your actual heart rate.
In our Fenix 9 example, Track Lab detected 93 seconds of cadence lock. The longest cadence lock I’ve detected so far was on the Garmin Forerunner 170: 320 seconds.
That matters because the data can still look believable even when it is wrong.
If your cadence is around 170 steps per minute and your actual heart rate is much lower, the watch can suddenly start reporting a number that looks realistic but is actually tied to your movement.
Track Lab lets us measure how long that happens instead of just saying we noticed it.
For runners who use heart rate zones, training load, or interval data, that can make a big difference.
How We Test GPS Accuracy
Heart rate is only half of the accuracy equation.
The other side is GPS. This is where many reviews stop at total distance. If a five-mile route comes back at 5.01 miles, the watch looks accurate. But that does not mean the GPS track was actually clean.
A watch can cut corners, drift off the trail, or wander under tree cover and still finish with nearly perfect mileage.That is why Track Lab looks deeper.
We analyze how closely the recorded route follows our reference track, how far the watch drifts from the actual path, and whether it consistently adds or loses distance.
This gives us a much better picture of GPS performance than simply looking at the final mileage.
Cross Track Error
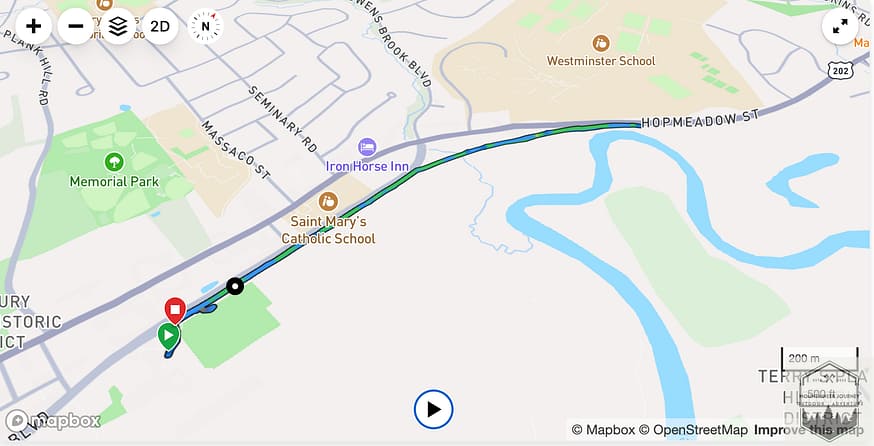
The first GPS metric we look at is Cross Track Error.
This measures how far the watch drifts sideways from our reference route.In the Fenix 9 example, the Cross Track Error was 2.0 feet.
That matters because a watch can report almost perfect total distance and still be consistently placing you off the actual trail. Cross Track Error helps us catch that.
It is especially useful on tight turns, switchbacks, narrow trails, and areas with heavier tree cover where GPS accuracy usually gets more difficult.
Lower is better. The closer that number stays to zero, the more closely the watch is following the actual route.
Fréchet Drift
The next GPS metric we use is Fréchet Drift. This looks at how closely the overall shape of the watch’s GPS track follows our reference route. This is probably our most important metric when it comes to GPS accuracy.
This matters because total distance can look accurate even when the route itself isn’t. A watch might cut a corner, drift through a turn, or wander off the actual trail, then make up that distance somewhere else.
Fréchet Drift helps us catch that by looking at the shape of the full route, not just the final mileage.
Why We Use Multiple Accuracy Metrics
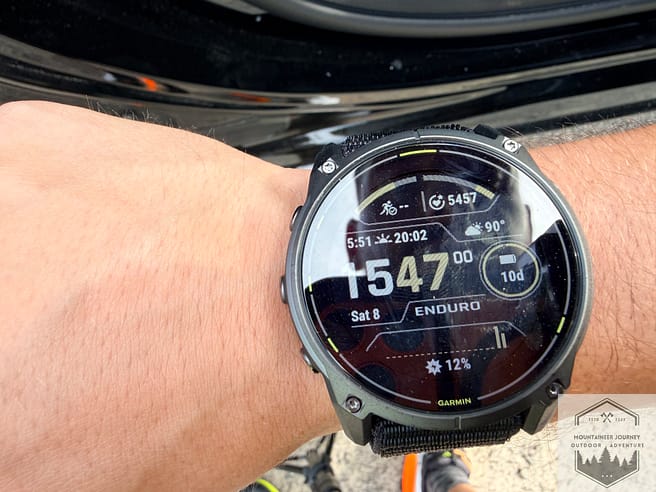
No single number tells us whether a GPS watch is accurate.
That is why we use several different metrics for both heart rate and GPS testing.
MAE can tell us the average heart rate error, but it might miss a major sensor failure. Distance error can tell us the final mileage was almost perfect, but it might miss the fact that the watch cut corners throughout the route.
Each metric shows us a different part of the picture.
When several of them point in the same direction, we can be much more confident in the result.
And when they disagree, that is usually where things get interesting.A watch might have excellent average accuracy but poor latency. It might record the correct distance but show more GPS drift than we would like.
That is why we do not base our accuracy scores on one graph or one number.We look at the entire dataset and use all of those measurements together before assigning a final accuracy score.
Why Our GPS Watch Testing Matters
At the end of the day, a GPS watch review should tell you more than what is written on the box.It should tell you how the watch actually performs.
That is why we built our testing around real-world use, reference equipment, and Track Lab. We want to know how accurate the GPS is, how closely the heart rate sensor follows the Polar H10, where the biggest errors happen, and whether those errors actually matter when you are running, hiking, training, or navigating.
We also use the same scoring system across every watch we test.That keeps the reviews consistent and makes it easier to compare one watch against another without changing the rules. The goal is simple.We are not trying to tell you that every watch is good.
We are trying to show you where each watch performs well, where it starts to struggle, and whether it is worth your money.
That is what our GPS watch reviews are built around.
Real testing.
Objective data.
And a clear answer on who the watch is actually for.

Tyler is the founder Mountaineer Journey and a professional Mountain Guide with 15+ years of technical experience in trekking, mountaineering, and trail sports. Having logged thousands of miles from rugged alpine summits to urban paths, Tyler provides rigorous, field-tested insights on hiking, walking, and trail running gear. All reviews are 100% unsponsored and unbiased, ensuring you get honest scoring based on real-world performance. His mission is to help outdoor enthusiasts of all levels find reliable equipment that ensures comfort, safety, and performance on any terrain.